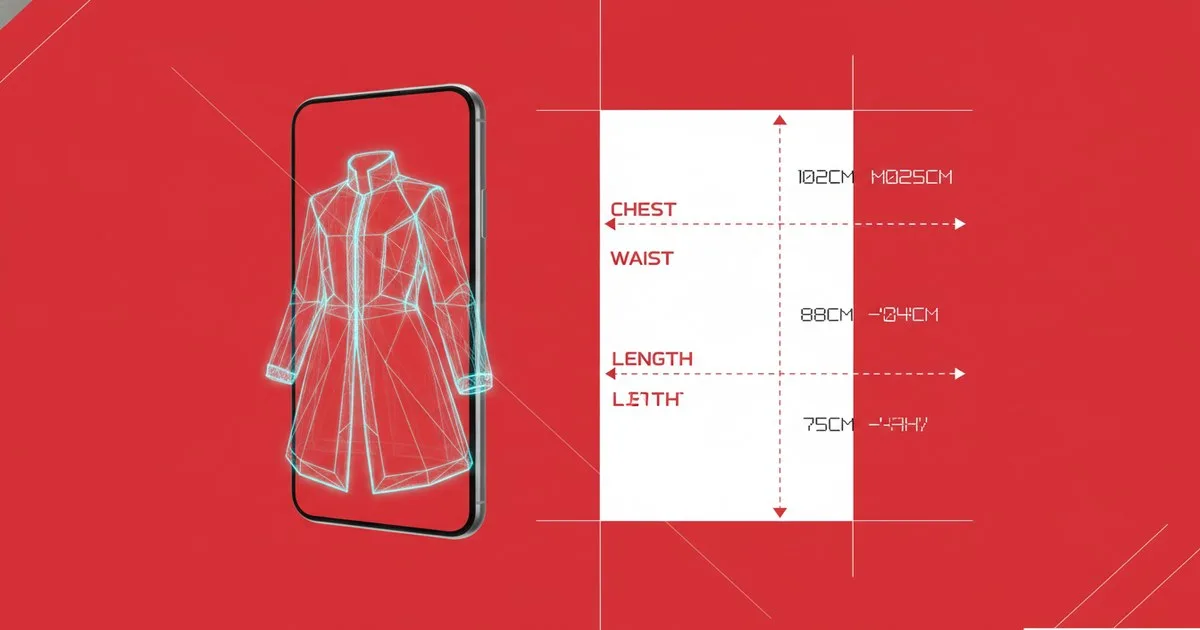
If you are an e-commerce director staring at a return rate above 30 percent, two categories of technology keep appearing in every vendor deck: virtual try-on (VTO) and size recommendation engines. They are not the same thing, they do not fix the same problem, and buying the wrong one first is an expensive mistake. This comparison gives you the evidence-grounded case for each, a clear verdict by use case, and the questions to ask before you sign anything.
Key Takeaways
- Virtual try-on primarily reduces style-driven returns; size recommendation engines primarily reduce fit-driven returns—and those are different failure modes requiring different fixes.
- Published industry data consistently shows fit and sizing as the leading cause of fashion returns, which gives size engines a structural advantage on raw return-rate reduction for apparel.
- VTO shows stronger conversion lift than return-rate reduction in most documented deployments, making it a revenue tool as much as a cost-reduction tool.
- The two technologies are complementary, not competing; the sequencing question is which problem is costing you more right now.
- Enterprise deployments of either tool require clean, consistent product data—that is the integration risk most vendors understate.
What problem does each tool actually solve?
Before comparing outcomes, be precise about inputs.
Virtual try-on overlays a garment onto a customer's image—either a photo, an avatar, or a live camera feed—so they can assess colour, silhouette, drape and styling before buying. It answers: does this look right on me or in my space? The technology has matured significantly for accessories and footwear, where geometry is simpler; for draped clothing it remains harder, as the cloth simulation research covered elsewhere on this site makes clear.
Size recommendation engines ingest body measurements—entered manually, derived from a quiz, or increasingly inferred from purchase history—and map them against a brand's size chart to predict which size will fit. They answer: which size should I order? Platforms like True Fit operate network-effect models, pooling anonymised fit data across thousands of brands and millions of shoppers to improve prediction accuracy over time. Fit Analytics, now part of Snap, takes a similar data-network approach with strong integration coverage across mid-market and enterprise retailers.
The distinction matters because the causes of returns are not uniform. Across the apparel industry, fit and sizing consistently account for the largest share of return reasons—estimates from multiple retail surveys place it between 50 and 70 percent of clothing returns. Style dissatisfaction (colour looks different in person, silhouette not as expected) is a secondary but real driver. VTO addresses the second category; size engines address the first.
Head-to-head comparison
| Virtual Try-On | Size Recommendation Engine | |
|---|---|---|
| What it is | AR/AI overlay of garment on customer image or avatar | Algorithm that maps body data to brand-specific size predictions |
| Best for | Reducing style/aesthetics-driven returns; lifting conversion; accessories and footwear | Reducing fit-driven returns; apparel with complex sizing; brands with wide international customer bases |
| Primary metric moved | Conversion rate, add-to-cart; return rate secondary | Return rate; also reduces customer service contact |
| Data dependency | High-quality product imagery or 3D assets; consistent photography standards | Historical order and return data; accurate size charts per SKU |
| Integration complexity | Moderate to high; PDP-level embed; 3D assets expensive to produce at scale | Moderate; API or widget; requires clean product taxonomy |
| Limits | Drape and fit accuracy still imperfect for woven apparel; avatar body diversity a known gap | Cold-start problem for new shoppers; accuracy degrades when brand size charts are inconsistent |
| Typical customer profile | Luxury, accessories, footwear, brands with strong visual identity | Multi-category apparel, fast fashion, brands with high SKU count and international sizing variance |
Virtual try-on: strengths and weaknesses
Where it genuinely delivers
- Conversion uplift is well-documented. Luxury and accessories retailers report meaningful increases in purchase confidence when customers can visualise a product on themselves or in context. Wanna Fashion, a VTO provider focused on luxury, cites significant conversion rate improvements for footwear and accessories in its published case material—a finding consistent with what brands and analysts report more broadly.
- Returns from style mismatch fall. When a customer can see that a colour reads differently on their skin tone than on a white studio background, they self-select out before buying, not after receiving the parcel.
- Brand experience value. For premium and luxury labels, the interactive moment has brand equity value beyond the return-rate calculation. It signals modernity and reduces the anxiety gap between online and in-store.
- Veesual is one provider worth evaluating here—Veesual focuses on on-model virtual try-on for fashion, allowing customers to swap models that better reflect their own body type, which addresses the diversity gap that undermines confidence in traditional model photography.
Where it falls short
- Fit accuracy for draped garments remains limited. A customer can see that a blazer looks sharp in silhouette; they cannot reliably tell from a VTO whether the shoulder seam will sit correctly on their frame. That is a physics and data problem that the industry has not fully solved.
- Asset production is a bottleneck. Scaling VTO across thousands of SKUs requires either 3D assets (expensive and time-consuming to produce) or consistent, high-quality photography under controlled conditions. Most mid-market brands are not there yet.
- Return-rate impact is harder to isolate. Because VTO also lifts conversion, the denominator of your return-rate calculation changes. Attributing return reduction specifically to VTO requires careful experimental design.
Size recommendation engines: strengths and weaknesses
Where they genuinely deliver
- Direct attack on the largest return driver. If fit accounts for the majority of your returns, a tool that improves size accuracy is addressing the root cause, not a symptom.
- Network effects compound over time. Platforms like True Fit and Fit Analytics improve as more shoppers use them and as more brands contribute data. A retailer joining an established network benefits from predictions trained on far more data than they could generate alone.
- Measurable, attributable impact. Because the intervention happens at the size-selection step, A/B testing is cleaner. You can hold out a control group and measure return-rate delta with reasonable confidence.
- Works across all product photography standards. Unlike VTO, a size engine does not require you to upgrade your imagery pipeline first.
- Bold Metrics takes a body-data-first approach—using AI to infer body measurements from a short quiz—which can be effective for brands whose customers are unlikely to have a tape measure handy but are willing to answer a few questions about fit preferences.
Where they fall short
- Cold-start problem is real. A first-time shopper with no purchase history and who skips the measurement quiz gets a generic recommendation. For brands with high new-customer acquisition, this limits early impact.
- Size chart quality is the ceiling. If your size charts vary by supplier, season or production run—which is common in fast fashion—the engine can only be as accurate as the data it maps against. Fixing this is an internal data governance project, not a vendor problem.
- Does not address style dissatisfaction. A shopper who orders the right size but finds the colour disappointing in person will still return. Size engines do not help there.
What does the data actually say about return rates?
Here is where intellectual honesty is required. Vendor-published case studies routinely claim return-rate reductions of 20 to 50 percent. Those numbers are real in some deployments, but they are not universal, and the conditions matter:
- Category matters enormously. Footwear and accessories VTO deployments show stronger return-rate impact than apparel VTO, because the fit-accuracy limitation is less severe.
- Baseline return rate matters. A brand with a 40 percent return rate has more room to move than one at 15 percent. Absolute reduction numbers are not comparable across retailers.
- Attribution methodology varies. Some vendors count any order where a recommendation was shown; others require the shopper to have interacted with the tool. These produce very different-looking numbers.
The honest summary: size recommendation engines have a more direct, more consistently documented impact on apparel return rates because they target the primary cause. VTO has a stronger documented impact on conversion and on return rates specifically for accessories and footwear. For a business audience evaluating ROI, that distinction should drive sequencing.
Who should prioritise which—and when?
Prioritise a size recommendation engine first if:
- Your return rate is above 25 percent and customer surveys point to fit and sizing as the primary complaint.
- You sell multi-category apparel, particularly with international size variance.
- You have the order history data to feed a network-model platform.
- Your product photography is not yet at the quality level VTO requires.
Prioritise virtual try-on first if:
- You sell accessories, footwear, eyewear or jewellery, where fit physics are simpler.
- Your return rate is moderate but your conversion rate is the bigger business problem.
- You are in luxury or premium, where the experience moment has brand value beyond the return calculation.
- You already have or can produce 3D assets or high-quality consistent photography.
Run both if:
- You are a large multi-category retailer with distinct apparel and accessories divisions.
- You have the integration bandwidth to run two tools without creating a fragmented customer experience.
- You can instrument both tools separately so you can attribute impact cleanly.
For technology buyers thinking about the broader AI-in-fashion stack, the AI watermarking and fashion content piece on this site is worth reading alongside this—the content infrastructure decisions you make now affect what AI tools can do with your product assets later.
What to ask vendors before you commit
- What is the return-rate methodology? Interaction-based or exposure-based? What was the holdout group design?
- What does your data network look like in my category and geography? A platform with strong US apparel data may perform poorly for European sizing or Asian markets.
- What internal data do you need from us, and in what format? Size chart consistency, SKU-level return reason codes, historical order data—know what you are committing to clean up.
- What is the integration timeline for our stack? Ask for reference customers on the same e-commerce platform you run.
- How do you handle cold-start shoppers? This is where many deployments underperform expectations.
FAQ
Does virtual try-on actually reduce return rates for clothing? For accessories and footwear, yes—documented return-rate reductions are consistent. For draped apparel, the evidence is more mixed; VTO improves style confidence but does not reliably solve fit accuracy, which is the primary return driver for clothing.
Which technology has a faster ROI for an apparel retailer? Size recommendation engines typically show faster, cleaner ROI for apparel because they target the largest return cause directly and are easier to A/B test. VTO ROI is real but often comes through conversion lift rather than return reduction alone.
Can I run both virtual try-on and a size recommendation engine at the same time? Yes, and for large multi-category retailers it is often the right answer. The tools address different failure modes. The risk is integration complexity and making sure the customer experience is coherent, not cluttered.
How long does it take to see return-rate improvement after deploying a size engine? Most enterprise deployments see measurable signal within one to two full selling seasons—enough time to accumulate statistically significant return data across a meaningful SKU range. Faster signals are possible in high-volume categories.
What is the biggest implementation risk for either technology? Dirty product data. Inconsistent size charts, missing SKU-level return reason codes, and non-standardised photography undermine both tools before they start. Data readiness is the integration risk most vendors understate in sales conversations.
Further reading
- Virtual Try-On Technology for the Luxury Industry
- Does Virtual Try-On Technology Actually Work for Fashion?
- 8 Fashion-Tech Conferences Worth Budgeting for in 2026 and 2027
- Browzwear
- Marvelous Designer
- Veesual
- Bold Metrics
- True Fit
- Fit Analytics
- Optitex