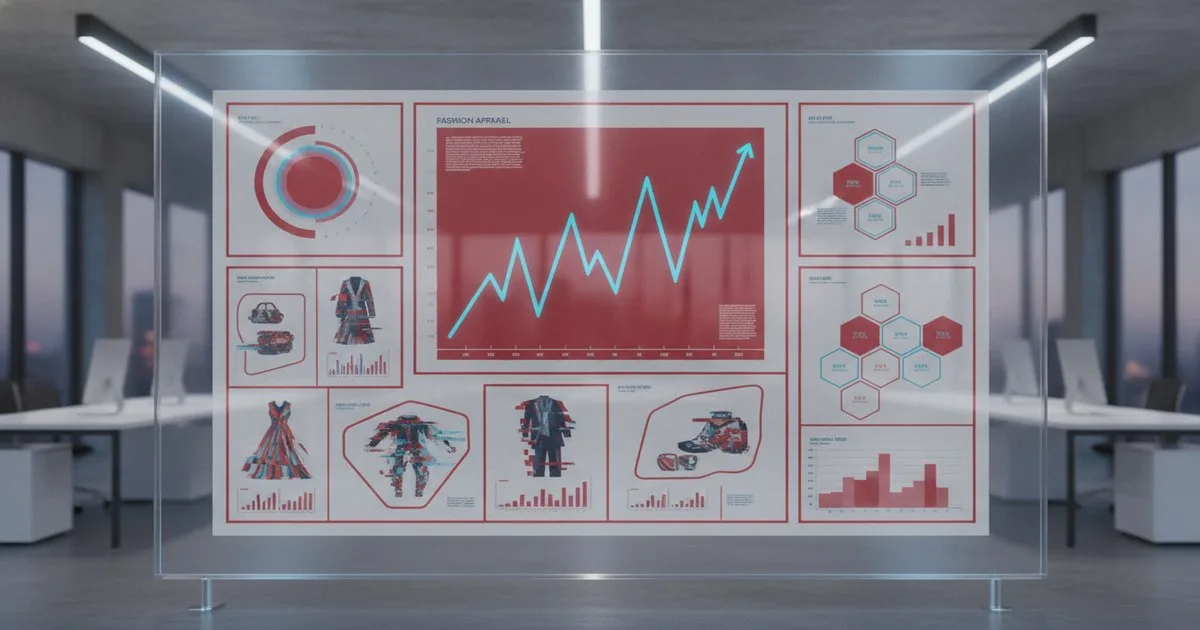
Merchandising analytics platforms aggregate fragmented data from your ERP, e-commerce, and POS systems to provide a real-time view of inventory health and sales performance. By automating the complex mathematics of retail, these tools allow you to make data-backed decisions on buy quantities, range breadth, and markdown timing without the manual spreadsheet grind. You stop guessing which SKUs will move and start buying based on proven rate-of-sale and size-curve velocity.
Key takeaways
- Eliminate Spreadsheet Risk: Automated platforms sync directly with your tech stack to remove the human error inherent in manual data entry.
- Optimize Size Curves: Advanced analytics prevent the common mistake of over-ordering outlier sizes while stocking out of core sizes.
- Protect Gross Margin: Real-time sell-through tracking identifies slow-movers early, allowing for strategic, smaller markdowns instead of end-of-season fire sales.
- Visual Range Planning: Integrating product imagery with financial data helps merchandisers maintain brand aesthetic while hitting revenue targets.
Why are you still using spreadsheets for range planning?
If you are a head of merchandising, you know the "Monday Morning" ritual: exporting CSVs from Shopify or NetSuite, cleaning the data in Excel, and trying to build a pivot table before the 10:00 AM trade meeting. This process is slow, reactive, and prone to catastrophic formula errors. In a market where McKinsey State of Fashion reports emphasize the need for extreme agility, relying on last week's manual data is a liability.
A merchandising analytics platform like Style Arcade replaces the spreadsheet with a live dashboard. It doesn't just show you what you sold; it shows you what you could have sold if you hadn't stocked out. This shift from descriptive to prescriptive analytics is the difference between surviving a season and scaling a brand. Major retailers like Zalando have long used proprietary versions of this tech to manage massive SKU counts; now, purpose-built platforms make these enterprise-level insights accessible to mid-market brands.
How does Style Arcade pull data from your existing stack?
To function effectively, a merchandising platform must act as the "intelligence layer" sitting on top of your existing software. It does not replace your ERP (Enterprise Resource Planning) or your e-commerce platform; it consumes their data.
What you need for implementation:
- ERP Access: To pull historical sales, cost prices, and current stock levels.
- E-commerce API: To track real-time digital sales, returns, and site traffic.
- Product Images: To enable visual range planning.
- Historical Data: At least 12–24 months of clean data for trend forecasting.
Style Arcade uses API integrations to pull this data automatically. Once connected, it cleans and categorizes the information, mapping it to your specific attributes (e.g., fabric, color, silhouette, season). This allows you to see, for example, that "Linen Mini Dresses" are performing 20% better than "Cotton Mini Dresses" across all regions, a feat that would take hours to calculate manually in a spreadsheet.
What specific metrics should a merchandising platform track?
Standard reporting tells you the "What." Merchandising analytics tells you the "Why" and the "Next." Beyond basic revenue, you need to track metrics that reflect the true health of your inventory.
- Rate of Sale (ROS): How many units of a SKU are selling per week per store. This is the heartbeat of your business.
- Sell-Through Percentage (ST%): The percentage of your initial buy that has been sold. Platforms like Style Arcade flag anything with a low ST% early in the season.
- Size Curve Health: Tracking if you are selling out of Mediums while being buried in Extra Smalls. This informs the "Buy Plan" for the next season.
- Cover/Weeks of Stock (WOS): How many weeks it will take to sell out of current stock at the current ROS. This prevents over-ordering.
- Return Rates by Attribute: If a specific fabric or factory is seeing a 40% return rate, the platform flags it as a margin killer before you re-order.
How do you use these insights to build a better buy plan?
Building a buy plan is the most expensive decision a merchandiser makes. A platform like Style Arcade turns this from a "gut feeling" into a mathematical certainty.
The Step-by-Step Process:
- Review Historical Performance: The platform aggregates last year's data, filtering by category and attribute.
- Apply Growth Targets: You input your desired growth (e.g., 15% increase in Knitwear). The platform calculates the required unit count based on historical ROS.
- Optimize the Size Curve: Instead of a flat ratio (e.g., 1-2-2-1), the platform suggests a curve based on actual demand. If your customer base is shifting, the data will show it.
- Visual Assortment Building: You drag and drop product images into the plan. This ensures the range looks cohesive while the backend keeps track of the total "Open to Buy" (OTB) budget.
- Finalize the Tech Pack: While the platform doesn't create the technical drawings, it provides the quantities and price points that go into your production orders.
Comparison: Analytics Platforms vs. Traditional Methods
| Feature | Manual Spreadsheets | Standard ERP Reports | Style Arcade / Analytics |
|---|---|---|---|
| Data Freshness | Weekly/Monthly (Manual) | Real-time (Static) | Real-time (Dynamic) |
| Visuals | None (Text only) | Rare | Full Visual Range Planning |
| Size Curves | Static/Estimated | Basic | Data-driven by SKU/Category |
| Forecasting | Manual Formulas | Limited | Automated Trend Prediction |
| Best For | Startups (<$1M) | Backend Operations | Growth-stage & Enterprise |
What can go wrong with automated merchandising?
No software is a magic bullet. The most common failure point is "Garbage In, Garbage Out." If your ERP data is messy—if SKUs aren't categorized correctly or cost prices are missing—the analytics platform will produce flawed recommendations.
Furthermore, the cost of running these data-heavy platforms is rising. As reported by TechCrunch (August 14, 2026), the energy costs for the data centers powering AI and heavy analytics are surging. This may lead to higher subscription costs for SaaS tools in the coming years. You must also account for the "human element." Data might suggest you stop buying sequins, but if your brand identity is built on evening wear, you have to know when to override the algorithm.
The Verdict: Who is this for?
If you are managing more than 50 SKUs and doing over $3M in annual revenue, you have likely outgrown spreadsheets. The investment in a merchandising analytics platform usually pays for itself within one season through reduced markdowns and fewer stockouts. As the industry moves toward "digital wardrobes"—a trend highlighted by the recent $7m funding for Whering as reported by Sourcing Journal and Just-Style (August 14, 2026)—the ability to track every garment's lifecycle from buy-plan to consumer-closet becomes a competitive necessity.
FAQ
Q: Does Style Arcade replace my ERP? No. It sits on top of your ERP (like NetSuite or ApparelMagic). The ERP handles the logistics and transactions; Style Arcade handles the intelligence and planning. You still need an ERP for warehouse management and accounting.
Q: How long does it take to see a return on investment? Most brands report a return within the first full buying cycle (approx. 6 months). The ROI comes from identifying "dead stock" early enough to move it at a 10% discount rather than a 50% clearance price later.
Q: Can it help with sustainability goals? Yes. By refining your buy plans to match actual demand, you reduce overproduction. Overproduction is the fashion industry's largest waste contributor; buying only what you can sell is the most effective sustainability strategy.
Q: Is it difficult to train a merchandising team on this? If your team is proficient in Excel, they will find these platforms intuitive. The interface is designed for merchandisers, not data scientists. Most platforms offer onboarding that takes 4–8 weeks.
Q: Does it work for multi-channel retail? Yes. It is designed to aggregate data from physical stores, wholesale partners, and e-commerce sites, giving you a "Single Source of Truth" for your entire inventory.
Q: What is the most important metric to watch? While all are useful, "Sell-Through" is the most critical. It tells you immediately if your product is resonating with the market at the price point you've set.
Further reading
- Whering CEO on why Google AI, eBay are betting on digital wardrobes
- McKinsey State of Fashion Report
- Hyperscalers and the cost of data centers